
Monthly Water Level Bulletin for the Great Lakes and Montréal Harbour
Information for the monthly bulletin prepared by the Canadian Hydrographic Service. LEVELnews, a newsletter published by Environment Canada, is included with the bulletin.
On this page
This PDF contains a series of line graphs showing monthly water level data for the Great Lakes and Montréal Harbour. The raw data is also found on the web pages in this section.
Gauging stations network
A network of gauging stations on both sides of the border on each lake is used to determine the average water level for the month. The following stations are used.
- Lake Superior
- Duluth
- Marquette
- Michipicoten
- Thunder Bay
- Point Iroquois
- Lakes Michigan/Huron
- Ludington
- Thessalon
- Milwaukee
- Tobermory
- Harbor Beach
- Mackinaw City
- Lake Ontario
- Toronto
- Oswego
- Cobourg
- Kingston
- Rochester
- Port Weller
- Lake St. Clair
- Belle River
- St. Clair Shores
- Lake Erie
- Toledo
- Cleveland
- Port Stanley
- Port Colborne

Water level advisory
Water levels for Lake Michigan-Huron, Lake St. Clair, Lake Erie and Lake Ontario are:
- above the level of chart datum
- above the average level for this time of year
Water levels for Lake Superior and Montréal Harbour are:
- above the level of chart datum
- below their all-time average for this time of year
Mariners should exercise extreme caution throughout the entire system. This is especially important during periods of strong winds when water levels can rise or fall significantly in a short period of time.
Water level monthly means
The monthly mean levels for the previous year and current year shown on the following charts are the average of water levels recorded at a network of gauging stations on each lake. Historical data from these networks are used to determine the all-time average and the historical extreme monthly levels.
Water levels for the Canadian stations in the networks are collected by the Canadian Hydrographic Service. The probable range of future levels for 6-month forecasts are prepared under the auspices of the International Coordinating Committee on Great Lakes Basic Hydraulic and Hydrologic Data by:
- Environment Canada
- the Detroit District, Corps of Engineers
Additional information on water levels in the Great Lakes system may be obtained by contacting the Canadian Hydrographic Service by:
- fax at 905-336-8916
- phone at 877-247-5465 (toll free)
- email at CATCWL@dfo-mpo.gc.ca
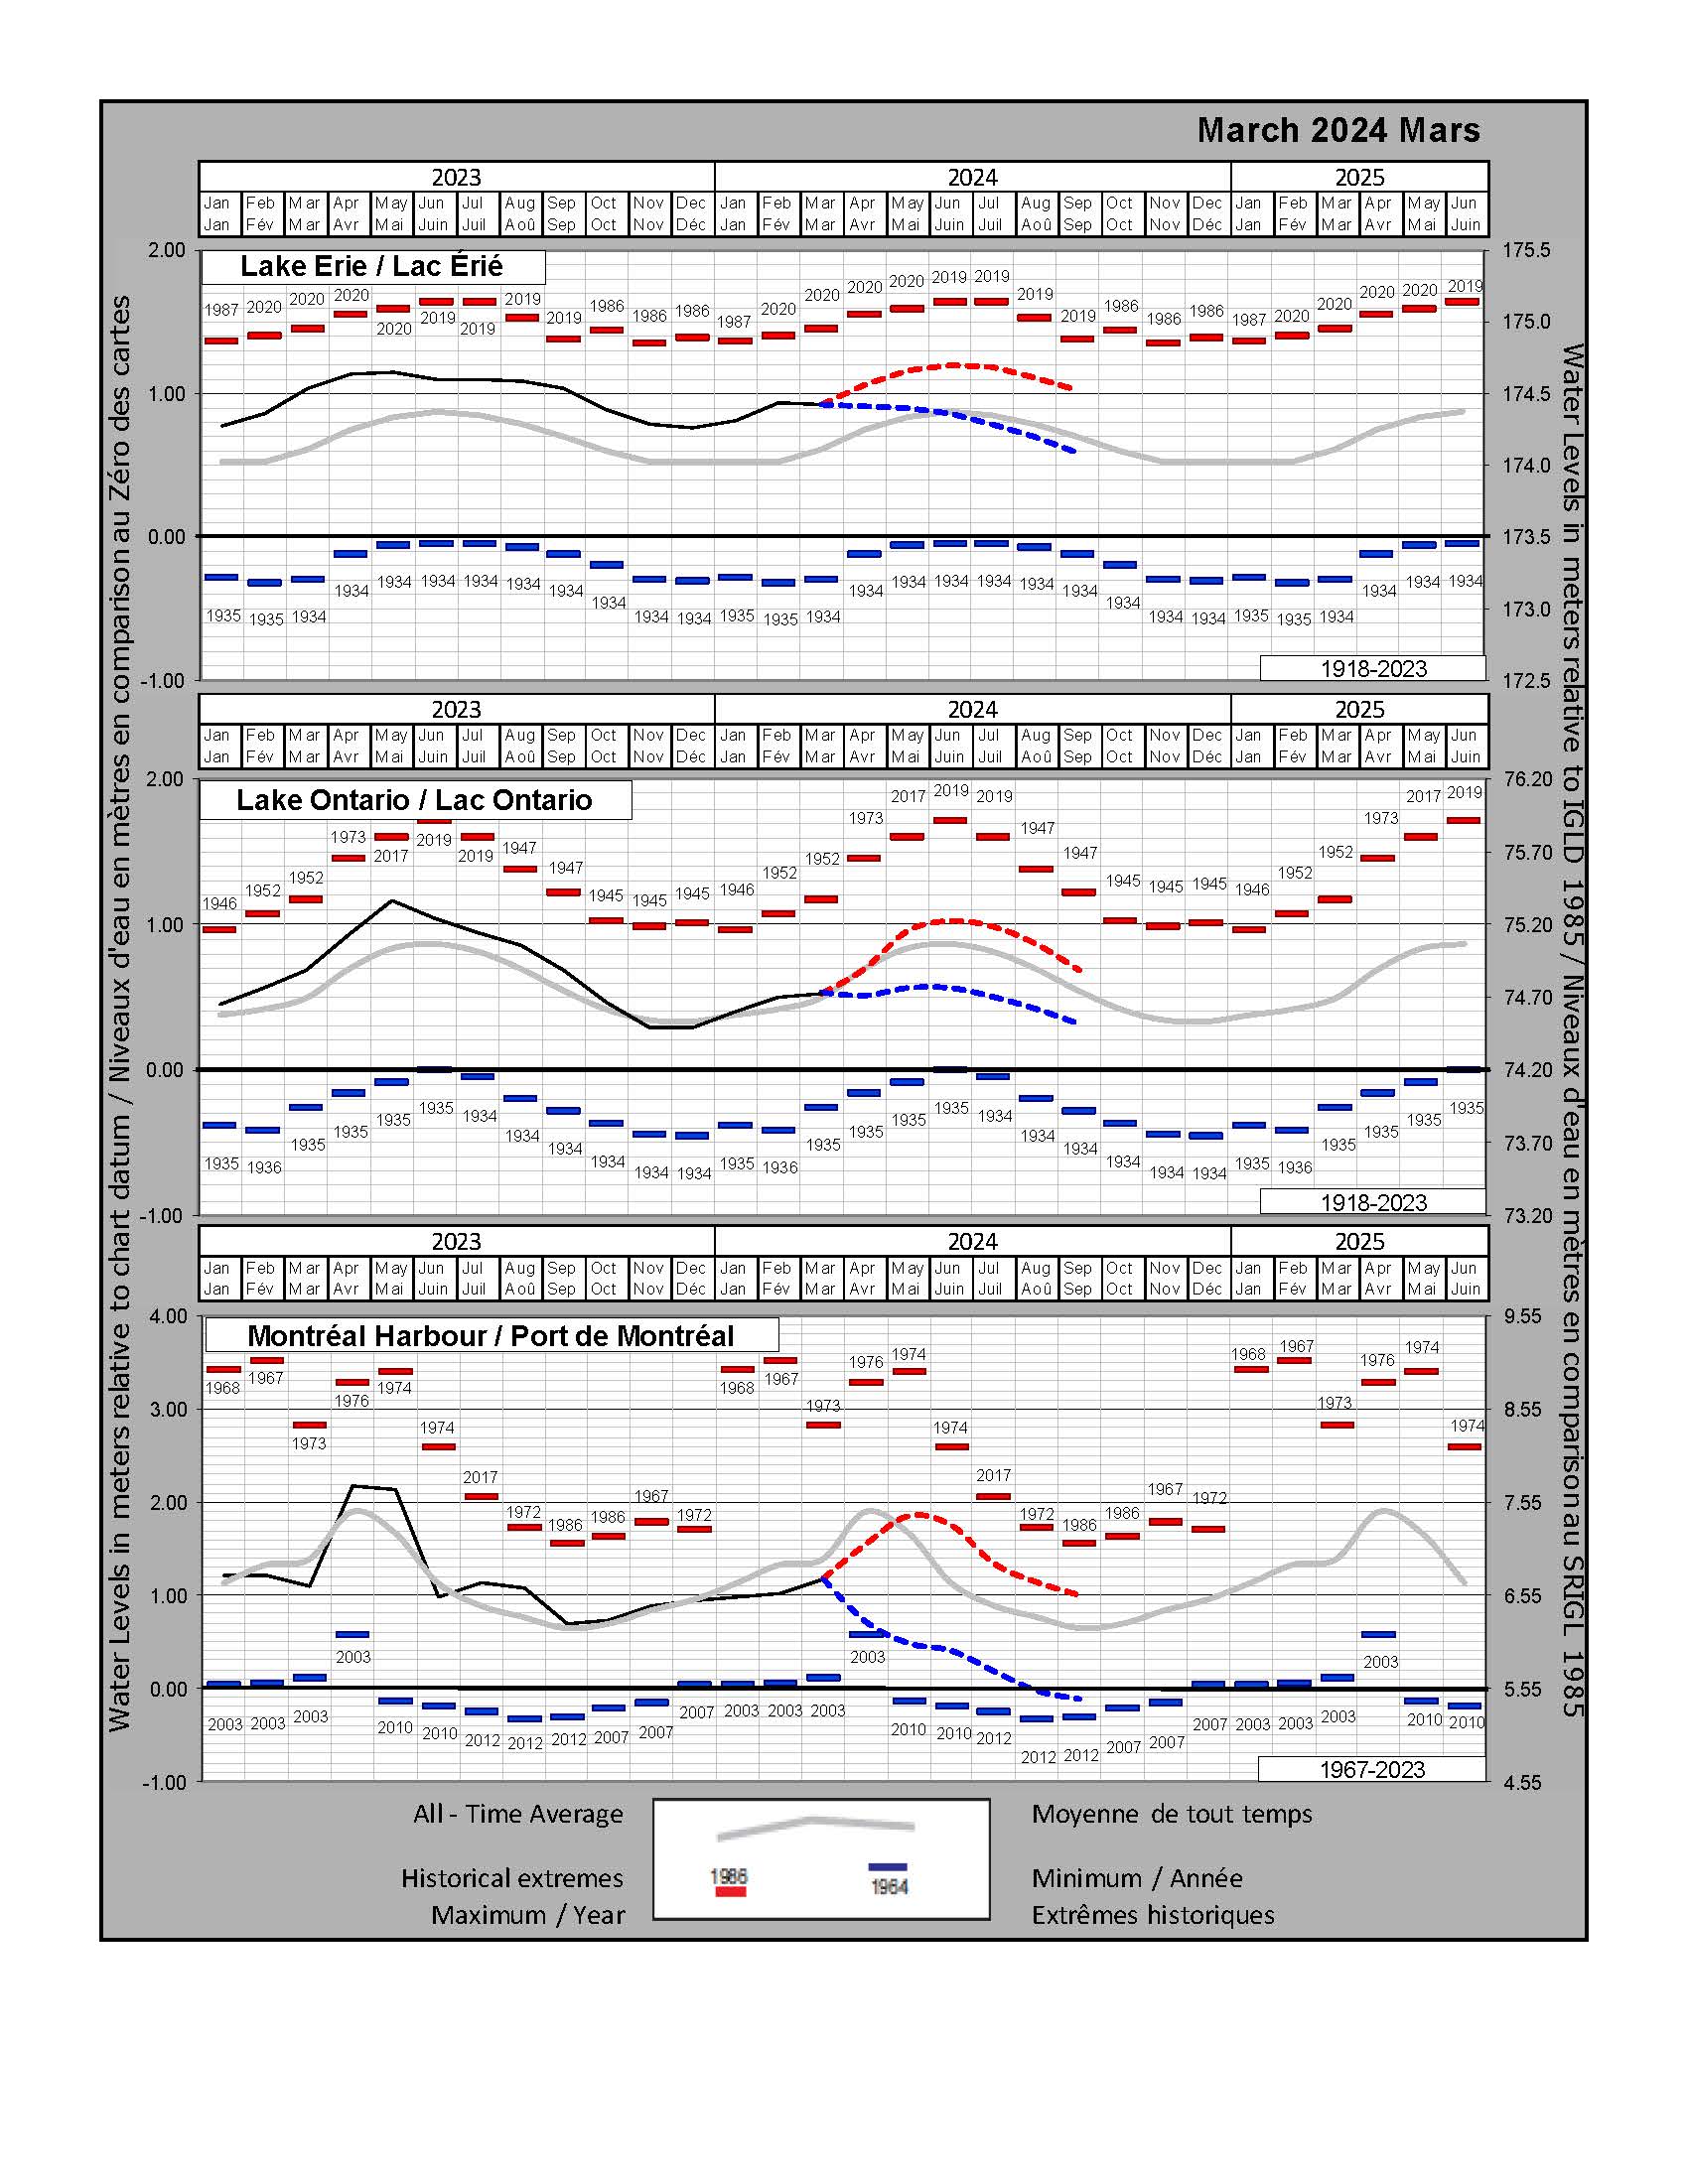
Water level charts
The charts show the water levels in metres relative to chart datum and to International Great Lake Datum (1985).
Click image to enlarge.

Full Monthly Water Level Bulletin for the Great Lakes and Montréal Harbour (PDF)
Water level table
The charts reflect monthly mean water levels in metres referred to International Great Lake Datum (1985).
| March 2024 | Lake Superior | Lake Huron | Lake St. Clair | Lake Erie | Lake Ontario | Montréal |
|---|---|---|---|---|---|---|
| Mean for Month (preliminary data) | 183.21 | 176.39 | 175.20 | 174.42 | 74.73 | 6.73 |
| Mean for month last year | 183.43 | 176.43 | 175.30 | 174.54 | 74.88 | 6.64 |
| Mean for month, last 10 years | 183.42 | 176.63 | 175.34 | 174.48 | 74.84 | 6.96 |
| Statistics for period of record | 1918-2023 | 1918-2023 | 1918-2023 | 1918-2023 | 1918-2023 | 1967-2023 |
| Maximum monthly mean / year | 183.61 1986 |
177.22 2020 |
175.83 2020 |
174.95 2020 |
75.37 1952 |
8.36 1973 |
| Mean for month, All Time | 183.24 | 176.33 | 174.94 | 174.11 | 74.69 | 6.93 |
| Minimum monthly mean / year | 182.74 1926 |
175.58 1964 |
174.05 1934 |
173.20 1934 |
73.94 1935 |
5.65 2003 |
| Probable mean for next month | 183.25 | 176.42 | 175.23 | 174.48 | 74.81 | 6.72 |
| Chart Datum | 183.20 | 176.00 | 174.40 | 173.50 | 74.20 | 5.55 |